You've probably seen this figure countless times.
I had been wanting to plot it for a while, which I finally undertook this weekend using SFML. I have published the related C++ code [here](https://github.com/flowsn4ke/mandelbrot_sfml) if you're interested.
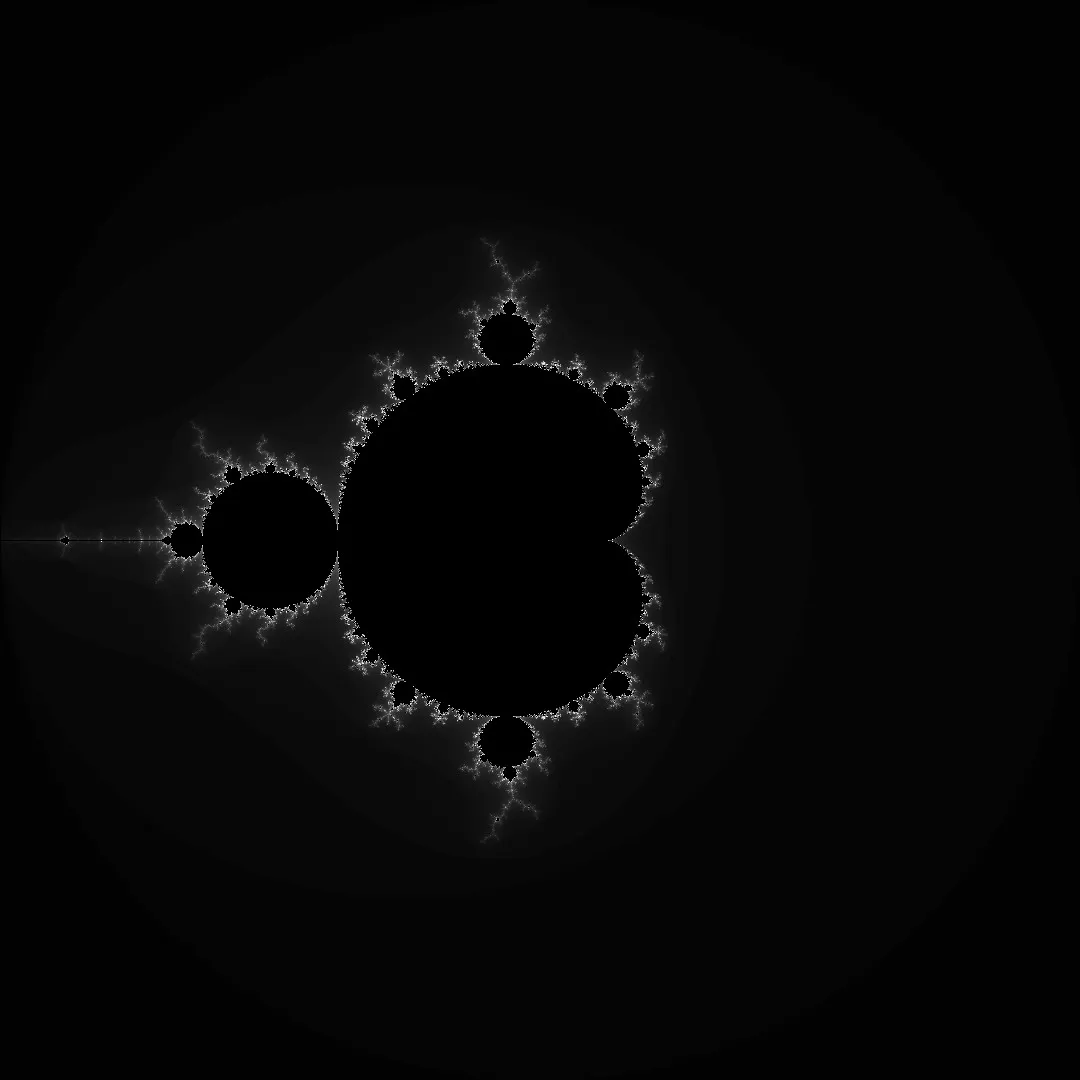
This is the Mandelbrot set, named after Benoit Mandelbrot, who had started his work on fractals with the 1967 paper *How Long Is the Coast of Britain?*
While the area of this shape is bounded, its edge is infinitely long, like that of the coast of Britain. No matter how much you zoom in onto the edge, you're going to find more roughness, subshapes of subshapes that have a length of their own.
It never ends.
The Mandelbrot set is described by the sequence
$
\begin{align}
z_{n+1}=z_n^2+c
\end{align}
$
To define if a point belongs to the set, you test it by computing the sequence where $c$ is the complex number representing your point, starting with $z=0$ and $n=0$.
If the sequence corresponding to that number is bounded, the point is said to belong to the set. Otherwise it lies outside it, and is given a color or brightness (inferred from how fast the sequence grows).
The interesting part happens near the edge of the set.
As we consider even the tiniest variations of numbers that are infinitely close to each other, we find widely different results.
This illustrates the sensitivity to initial conditions, typical of chaotic systems.