I placed my first trade in 2011.
The Société Générale was still experiencing the ripples of the 2008 crisis.
At the time, I had managed to save €15K while studying law at La Sorbonne and working full-time as a cashier at Monoprix to sustain myself.
I bet almost all of it on the idea it was too big to fail.
My trading account plunged in the red for a while.
I was so relieved when my P&L was back in the green I exited my position way too soon.
Even if I still made a decent +45%, this was a foolish trade, worthy of WallStreetBets.
Nonetheless, I kept at it, doing opportunistic trading here and there, and refined my approach over time (otherwise I would obviously not be writing these lines).
As years went by, I started getting the nagging feeling that I should either stop trading entirely, or become disciplined about it.
There's only so much you can do and learn going half the way[^2].
Since I would not do the former, I resolved on the latter.
With the most important question defined, it was a matter of taking the most simple step forward.
I had been thinking about backtests[^3] for a while.
This was as good a place as any to get to work.
Backtests require three things: (1) historical data, (2) a strategy to test and (3) some code to integrate them.
Given my background in tech, the code isn't exactly the issue in my case.
A researcher friend suggested I take a look at [Kaggle](https://www.kaggle.com/) for the data.
Three clicks later, I had downloaded a bunch of historical data with open and close prices for a bunch of cherry-picked[^4] tickers.
A trader I met at an applied mathematics conference suggested I implemented [[Simple Moving Average (SMA)]], it being the dumbest thing he could think of.
Having 'simple' in the name was enough for me.
I had all the ingredients to get cooking.
To implement SMAs, you want to dynamically compute two numbers[^5]: (1) a *fast average*, representing growth over, say, the last 20 days, and (2) a *slow average*, over, say, the last 50 days.[^6]
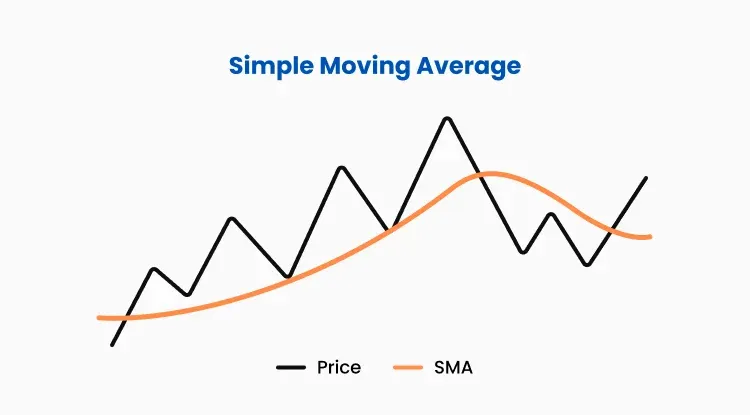
The fast average reflects shorter trends than the slow one.
Visually, this means in the image above we would have three lines; one for the price, one for the slow SMA, and one for the fast SMA, which would be more jagged up.
The strategy[^7] relies on comparing the two.
If the fast average is bigger than the slow one, we say the market is in a bullish state for that security.
Otherwise the market is said to be bearish.
This comparison is used to make buying and selling decisions.
We buy a security when its fast average just became bigger than its slow one.
We sell it when the reverse happens.
That's it.
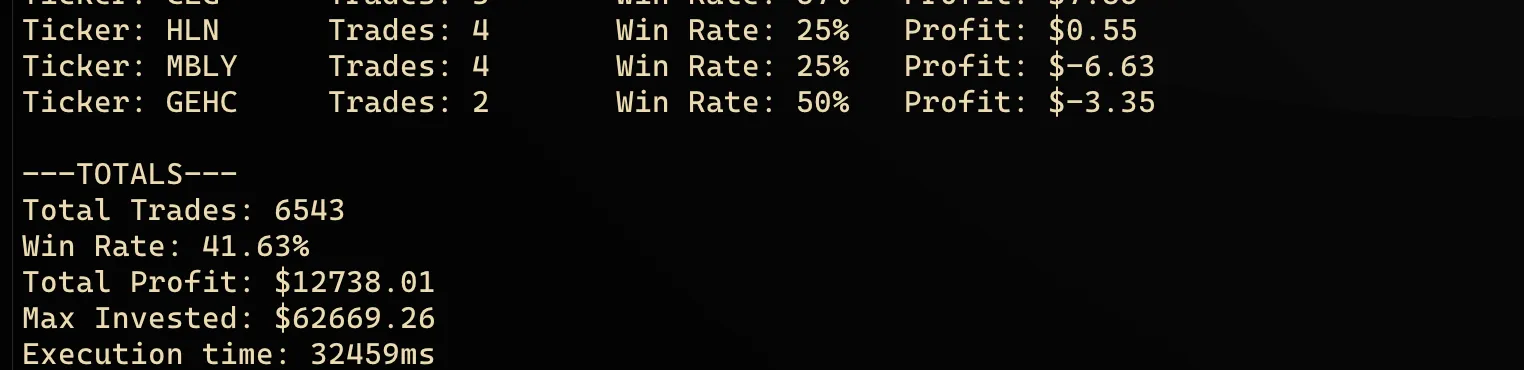
You run the backtest, and this is what you see.
>*"Look ! A pie in the sky !"*
>— Every dead investor ever
There's no shortage of things being deeply wrong with this.
First, let us take a look at the limits of the SMA strategy itself.
SMAs are lagging indicators by nature. In other words, you always arrive at the party once the cake is gone.[^8]
The impressive 20.32% return you see spans 5 years, so the compounded annual growth rate is only a shy 3.77%.
This is much less than the overall market returns during that period.
Depending on the years, you might even be trailing *behind* inflation.
Further, the backtest doesn't account for broker fees. Then the invested money comes out of thin air (no upper limit). Etc.
You get the point.
Second, let's discuss the feedback loop itself, aka the backtest.
Where did the magic numbers for the averages come from? Why 50 and 20 days? The answer hints at deeper issues. I'd wager they come from... other backtests.
It might sound smart to run a bunch of backtests with different granularities for the averages, and pick the ones that perform best.
It's a terrible idea.
What you'd be doing is observing the past with statistical methods and betting on the future to be a nice enough fella to behave like the past.
Tweaking a strategy over and over until it gets good results in backtests is the equivalent of coming to an exam and asking the teacher to test you on the only subject you studied during his course.
Markets are no different.
You'd think scientists and researchers would know better.
I stumbled onto a paper on trend prediction for the Egyptian stock market using ML (Elsegai et al., 2024), which illustrates the point vividly. The authors congratulate themselves for having identified a model that yields consistently better results... in the past.
While attending lectures on statistics at Arts & Métiers, I kept pointing at the underlying assumptions and hidden limitations behind the chosen probability distributions, because my brain was stuck and could not make sense of it. It finally clicked when the teacher, out of answers, just sighed and answered "we don't know what else to do". I admire the tired honesty behind the statement.

Part of the issue is, I think, the market's feedback loop.
Organizations hate uncertainty. They're willing to pay stupid amounts of money for so-called specialists to make them feel like the world is orderly and the future can be predicted. Scientists both need and want to make money. They start making compromises with science and logic, "just for a little while". It sure would be nice to get a new car, make your family happy, buy a house, go on vacation...
Newcomers arrive on the market. They see 'successful' charlatanism. It must be the case those people understood something. They want to be taught. They pay to be taught. They don't understand it, but it feels that some day they might, and they're making good money copy-pasting recipes anyway. And because they invested so much time and effort in that direction, they start actively avoiding questioning the whole endeavor, like someone afraid to check their mail because they don't want to find the unpaid bills.
This is a self-reinforcing process.
The problem is real.[^9]
Overfitting also happens at another level here.
Your data is likely to be missing (1) some, if not most companies and (2) bankrupt companies.
This is what's known as the survivorship bias, often illustrated by relating Abraham Wald's work on airplane damage during WWII.
Allies wanted to better protect airplanes, and asked Wald to take a look at the damage displayed by the aircraft on tarmac.
He had the insight the most valuable data was missing: airplanes that were hit in critical spots could not have returned.
This meant that missing data was perhaps more important than available one.
In other words, you don't stay alive by carefully watching healthy people, emulating them down their minute behaviors; you learn how people die and avoid that like the plague.
>"All I Want To Know Is Where I’m Going To Die So I’ll Never Go There."
>*— Charlie Munger*
Such holes in datasets irremediably mess up models. They skew the probability distribution towards that of the assets subjected to analysis, essentially baking gigantic blindspots into it.
Does this mean we should discard backtests?
Yes and no.
If you engage in backtests and try to fix every blindspot you are able to identify to improve your results, you're still overfitting to past data.
I think they can be a good sanity check to test strategies.
Most importantly, I think past data gives us more insights into probability distributions, but not so much when it comes to the order of events.
If you remove the 'back' in 'backtests', and start using synthetic data, I'd say you get a much more robust test for your strategies.
What's more, it helps prevent overfitting (though not entirely), since the data you test your strategy against is different every time around.
This requires, however, accepting the fact you can't predict the future, when you're standing in a crowd of people that are busy trying to predict it.
If you need to be convinced, perhaps a quick look at the performance of past predictions and predictors could help.
I joke sometimes an expert is someone that knows how to explain why his solutions do not work[^10].
As they say in Russian, in every joke there is a little bit of joke.[^11]
___
## Bibliography
Elsegai, H., El-Metwally, H. S. H. M., & Almongy, H. M. (2024). *Predicting the trends of the Egyptian stock market using machine learning and deep learning methods.* Computational Journal of Mathematical and Statistical Sciences, 4(1), 186–221. https://doi.org/10.21608/cjmss.2024.320645.1077
[^2]: An idea beautifully illustrated in Kahlil Gibran's poem [[Gibran - Do Not Love Half Lovers|Do Not Love Half Lovers]].
[^3]: Backtests consist of testing a trading strategy on historical data.
[^4]: I managed to close my eyes on the cherry-picked part. My target was to run a backtest, not becoming George Soros overnight. Repeat after me.
[^5]: To make computing the moving averages efficient and avoid redundant computing, I implemented a [[Circular Buffer (Ring Buffer)]].
[^6]: Even writing this make my eyes bleed. Why those magic numbers? But again, we're running a backtest, not competing with Citadel. More on all that later.
[^7]: If I dare call it that. It's really more of an indicator, a lagging one at that. Try trading with it and you'll make less than inflation, not to speak about the overall market returns.
[^8]: In mathematical terms, an SMA acts as a low-pass filter. It smooths out noise but creates phase shift.
[^9]: It goes without saying this process is far from being limited to statistics.
[^10]: And sell solutions that don't work, by reciprocity.
[^11]: In the original: "В каждой шутке есть доля шутки".